Sharing a Dashboard
You can share your Dashboard with colleagues in your organisation, and/or with practices who contribute data.
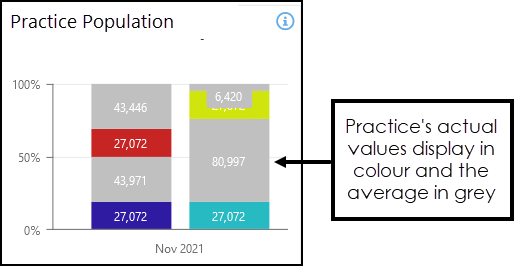
When a Dashboard is shared with practices, they can view their data against the average. In this example, grey has been selected as the average colour.
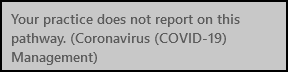
If the Dashboard contains a widget relating to a pathway that the practice doesn't report on a notification displays ' Your practice does not report on this pathway, (pathway name)'.
Sharing a Dashboard
-
Select your Dashboard.
See - Searching for a Dashboard or Extract. - Select Edit from the toolbar.
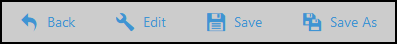
- Select Properties from the toolbar.

- From the Properties select either:
- Share Dashboard: To colleagues within your organisation
Enables colleagues to view your dashboard. - Share with Practices: To Practices sharing data with your organisation
This enables practices reporting data to your organisation, for example, Health Board, to view their data against the average values for all practices in your locality.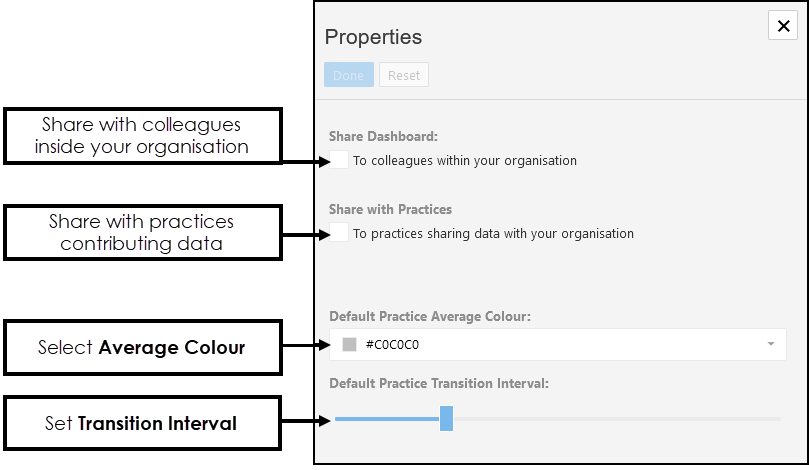
- Share Dashboard: To colleagues within your organisation
- If you are sharing the Dashboard with practices, select the drop-down to choose a Default Practice Average Colour to represent the Practice Average for your locality. Training tip - Review the colours used in the Dashboard to ensure a suitable contrast for the Average Colour.
-
Next, set the Default Practice Transmission Interval, this is used in Pie Charts, for example, when there are multiple dates to set the viewing time for each chart.
- Alternatively, to stop Sharing, clear the checkbox.
-
Select Done to update and X to close the pop-up.